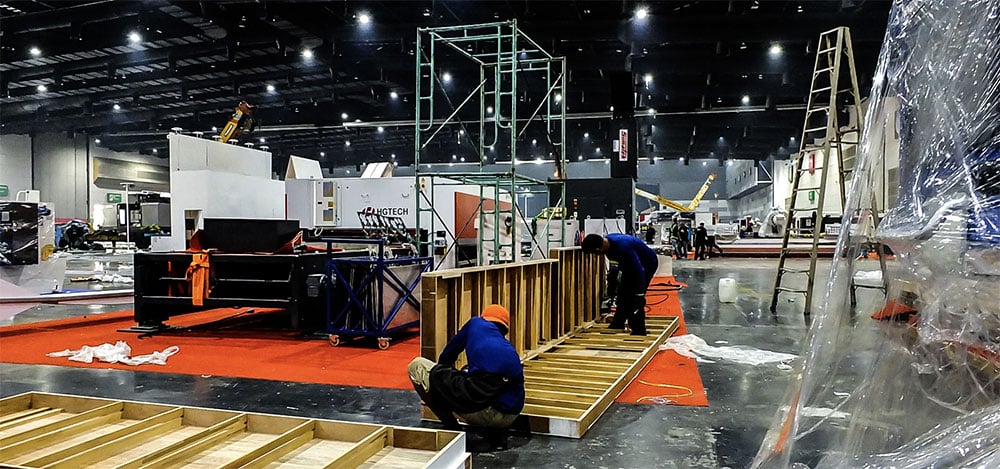
New research provides benchmarks for trade show labor and materials handling cost in 16 cities
“We believe this data is a valuable and important benchmarking tool,” said Jessica Sibila, executive director of The Exhibitor Advocate. “Every show is different but having a tool like the Material Handling and Labor Rate Survey allows exhibitors to better estimate their expenses prior to participating in an event.” 
She continued, “It allows show organizers to evaluate how their show compares to city averages and how their negotiated rates may impact exhibitors. And it allows facilities to understand how their costs compare to other destinations. All of this is important information for all stakeholders in the industry to have.”
TSNN takes a deeper dive into the report to provide analysis of the survey, which was prepared by Tradeshow Logic, an independent show management and event solutions company, and certified by EVOLIO Marketing, an independent third-party research agency. To paint the full picture, we asked leading service contractors including Freeman, GES and Fern, and Exhibition Services Contractors Association (ESCA) to provide their take on the report. Here’s what we found.
The Back Story
The Annual Survey of U.S. and Canadian Labor Rates was first published by Tradeshow Week magazine beginning in 1980. After Tradeshow Week ceased publication in 2010, various groups produced the survey intermittently. The most recent version was prepared in 2017 by EDPA, the Experiential Designers and Producers Association. EDPA has officially turned over the production of this annual analysis to The Exhibitor Advocate.
“The pandemic caused many shows to skip one, two or even three show cycles. In the process of building back, the exhibition industry has faced rising inflation, staffing shortages, added health and safety costs, and supply chain issues,” according to the 2022 Material Handling & Labor Rate Survey.
The Methodology
The data included in this study is based on secondary research sourced from 160 publicly available convention and exhibition exhibitor manuals and rate forms. The events, manuals and forms have been selected by market, based on availability of data (rates and services) across a representative sample of events and major industry sectors and sizes (net square footage and number of attendees).
What It Means
When evaluating the data, it’s important to understand: “Many variables beyond just the cost of labor factor into the determination of labor and material handling rates, including: size and complexity of the show; depth of attendee services and show management requirements; show schedule; required equipment; distance to deliver equipment; dock accessibility; and ease of moving into and out of a facility,” according to the report.
The result: It’s extremely difficult to come up with year-over-year percentage changes unless you have an apples-to-apples comparison with the same show data, as well as a significant sample size. “It should be noted that the rates are averages and should serve only as a benchmark. Every show is unique,” according to the report.
“It is apples to apples in that the same cities were used for both 2017 and 2022; however, a random sample of shows was utilized,” Sibila said. “This is not meant to be a study of particular shows from year to year.”
That being said, the 2022 Material Handling & Labor Rate Survey provides a starting point for budgeting and a baseline for future years (especially if the same shows and cities are used).
Key Data Points
The averages are compiled from data that represents events held during January through Nov. 2022, at 16 major U.S. convention centers and facilities in Anaheim, Atlanta, Boston, Chicago, Dallas, Houston, Las Vegas, Nashville, New Orleans, New York, Orlando, Philadelphia, San Antonio, San Diego, San Francisco and Washington D.C.
The report provides cost ranges from high to low:
- The lowest average straight time installation and dismantle rate was in Atlanta ($99.66), and the highest rate was in New York City ($235.05).
- The lowest average straight time electrical rates were in Nashville and New Orleans ($77.00), and the highest rate was in Philadelphia ($187.60).
- The lowest average Per LB material handling rate (before deadline) was in Atlanta ($1.02 Per LB), and the highest rate was in Philadelphia ($2.86 Per LB).
Outpacing Inflation
It probably comes as no surprise to show organizers, exhibitors or suppliers that trade show labor and materials handling costs outpaced the rate of inflation in 16 cities from 2017 to 2022, according to the report. But by how much? The answer depends a complex set of factors, which some industry leaders contend makes it nearly impossible to prove.
Based on the report’s analysis over the period from 2017 to 2022:
- The average exhibitor kit installation and dismantle rates outpaced the rate of inflation by 3-6%.
- The average exhibitor kit electrical labor rates outpaced the rate of inflation by 8-12%.
- The exhibitor kit material handling rates outpaced the rate of inflation by 18-31%.
“I would not be surprised to see that anything labor related reflects the general economy and as a result significantly outpaces general inflation,” said Aaron Bludworth, president and CEO of Fern. “This would especially be the case in an industry like ours that had a rapid decline and a rapid recovery. As to the percentage, that would require a very complex analysis that is unlikely sufficiently done in this report.”
He continued, “Most importantly, Fern works very hard to keep costs to our clients, both exhibitors and organizers, in check and pacing with our costs of operating our business. We are also very transparent in the process, which is why we created the first in the industry fully transparent, no added charges, material handling pricing model Fern’s 1Rate.”
In response, Sibila added that all industry stakeholders have a vested interest in the viability of conventions and trade shows.
“The current economics are creating an existential challenge and resulting in reduced participation in exhibitions,” she said. “It’s important we work together to address this issue with all stakeholders in the industry.”
Big Picture
“Generally, I look to industry media and organizations like CEIR for industry data and reporting that are not focused on a specific outcome that could tend to sway the way data is interpreted and portrayed,” Bludworth said. “So, I look at these types of reports with skepticism, regardless of the characterizing done.”
TSNN asked ESCA to weigh in.
“Our current economic landscape has driven inflation rates to a recent high,” said ESCA Director of Operations Julie Kagy. “Our members are not immune to these same cost pressures and are working diligently to manage the impact on their organizations. Data shared by our members confirm they have incurred significant cost increases in direct labor, indirect labor, supply chain, equipment rental and petroleum-driven costs that far outpace average inflationary rates.”
She added, “We have requested the raw data utilized to compile this survey. We look forward to thoroughly analyzing that data and providing an insightful reply.”
Freeman and GES declined to comment on the results of the study.
"Under the methodology section, it cites that the information was retrieved from 160 shows (~5%) which we believe is too small of a sampling size to form an opinion,” according to GES officials. “We also don’t have any info on the show profile to agree or disagree on this claim.”
Sibila added that as stated in the report, and validated by two independent third parties, the sample size constitutes a representative sample for the research.
“There is a margin of error of +/- 10% and does not account for variables such as net square footage, industry segment or attendance,” she said.
For a full list of costs by city (and to make your own determination about how to use the data), download a free copy of the survey here.
Guest blogger: Danica Tormohlen - https://www.tsnn.com/news/new-research-provides-benchmarks-trade-show-labor-and-materials-handling-costs-16-cities


